NREL Module Efficiency - Then and Now

In April 2009 I began my career in the solar industry with Eos Energy Solutions, a small PV installation “start-up” out of the owner’s house near Center City Philadelphia. I no longer work directly in solar, but it’s still a passion of mine. During this time I recall looking at NREL’s “Best Research-Cell Efficiencies” graph trying to decipher the different technology and compare it to what we were installing. Below is the 2005 graph - I had this printed and pinned to the wall near my desk.

Image courtesy of NREL.

Image courtesy of NREL.

It’s now 2020, more than ten years later, and I was wondering what that graph looks like now…

Image courtesy of NREL.

Image courtesy of NREL.

We mostly installed mono and multi-crystalline with some thin film mixed in. In 2005, mono and multi efficiencies peaked at around 24% and 19% respectively. In the 2020 graph, mono and multi efficiencies were about 26% and 23% respectively. Modest gains for sure in the crystalline silicon sub-sector, but really impressive gains in the multijunction sub-sector with peaks in the high 30s for non-concentrators. It’s also great to see so many more technologies being tested and pursued. If you’re curious what some of these technologies are, NREL has good summary on the topic. Or if you are interested in what other PV research NREL is working on, follow this link. For the crystalline silicon market, and for those customers looking at installing PV on their house or business, does the efficiency plateau mean most commercially available modules are closer to the upper-bound efficiency now? (In 2009-2014 I recall most efficiencies in the 14-16% range.) Or because we’re pushing the theoretical efficiency limit, and there is no cost-benefit to improve manufacturing process to realize the small cell gains, price stratification has remained the same? In another post I’ll do some $/watt comparisons to see how the market has changed.

Observations on Construction Submittals

Per the AIA (A201, General Conditions of the Contract for Construction), the purpose of submittals are “to demonstrate for those portions of Work for which submittals are required, the way by which the Contractor proposes to conform to the information given and the design concept expressed in the Contract Documents.”

Submittals are the confirmation of the contractor’s intent to comply with the design concept.  The importance of this compliance process is emphasized by the prerequisite condition stated in A201:  “The Contractor shall perform no portion of the Work for which the Contract Documents require submittal and review of Shop Drawings, Product Data, Samples, or similar submittals until the respective submittal has been approved by the Architect.”

At a minimum, designers should be generating construction documents that contain enough detail that clearly demonstrate a design intent.  Additional detail from designers - equipment or process specifics - is beneficial but not critical to project success (albeit with a higher risk of overages).  For projects with expedited project timelines (design-build, EPC), minimum designer input dictating general sizing, spatial relationships, and arrangement can be enough information to advance project steps.  In these scenarios, the submittal process can be utilized by the designers to fine tune a design and verify system coordination to ensure performance needs are met.

However, on standard or typical projects, submittals are not intended to be an opportunity to alter the design concept by either designer or contractor, but the reality is they often function in that capacity.  This 2006 AIA article takes it a step further describing the process as a game between the design and construction teams.  While most may treat it this way – a cat and dog fight – the analogy cuts to the root of many of the process’s problems.

Image courtesy of Looney Tunes

Image courtesy of Looney Tunes

The reality is submittals and the submittal process are really critical to project success.  It represents one of the last opportunities to make changes (large and small) without causing a compounded affect to cost.  For a seemingly typical and simple process, the problems are well rooted in construction culture and are still largely evident.  The workflow has improved recently with shared project management software, but there are still efficiency gains to be had.

A case study authored by Catarina Pestana and Thais Alves of San Diego State University titled “Study of the Submittal Process Using Lean Construction Principles” did an analysis of submittal cycle time for a 12-story, 220,000 sf, mixed-use, CIP concrete new construction project in San Diego, CA around 2010.  They were able to calculate actual cycle times at each process step (GC initial review, A or A/E review, GC distribution) and compare against estimated times.  Most of the results were expected: actual lead times exceeded estimated, actual lead times average and median were about 32 days.  A few of the surprise findings were:

  1. The GC distribution cycle time exceeded GC initial review cycle time by about 3 days.

    1. Submittal distribution is expected to be the least burdensome step as it should require less technical review than the other two.

  2. Shop drawing review lead times (generally more complex) were about 10 days less than product data reviews.

    1. Shop drawings are generally more complex and thus the expectation would be for a longer lead time.

  3. Architect-only review lead times on average were 12 days longer than those also requiring the review of an engineer.

    1. Because an A/E review requires additional hand-off to/from the engineer, it would be expected that the cycle time would be longer.

Interestingly, it was the GC review and distribution that caused the difference in lead times for both 2 and 3 above; the cycle time for the design professional review was the same for both.  In this study, the longer distribution times were attributed by the contractor to “the architect finishing the design”, thus requiring change orders (part of the change order process was incorporated into the “distribution” step).

 From my experience, here’s where I see waste in the submittal process:

  1. A submittal is received that did not follow the compliance requirements.

  2. A submittal is incomplete (covers only part of system/equipment).

  3. A submittal is poorly labeled; it is unclear what is being submitted on.

  4. A submittal is submitted in the wrong sequence (a sub-component to a larger component that has yet to be submitted on).

  5. A submittal is submitted that is not required.

  6. A submittal is disguised as a substitution request.

  7. A submittal is not previously reviewed by the GC.

  8. A submittal is overlooked or forgotten (all parties guilty here).

  9. A submittal is not applicable to the project at-hand.

  10. A submittal is provided by a project team member deep down the contractor org chart (sub-vendor to a vendor to a sub-subcontractor to a subcontractor to a GC).


From my experience, here are a few solutions to minimize submittal process waste:

  1.  Require a standardized control number for all parties involved.

    1. Why?  This improves coordination, avoids confusion, and eliminates the unnecessary step of manually creating/adding/altering unique control numbers.

  2. Require the GC generate a schedule of submittals prior to issuing submittals and have it reviewed by the design team for completeness.

    1. Why?  This gives the design professionals an opportunity to ensure all critical components/equipment/systems are accounted for.

  3. Specs should clearly describe what submittals are needed.

    1. Why?  While the general spec format is standardized, how specific submittals are requested is oftentimes determined by the architect (and is not standardized).

  4. Specs should clearly describe how submittals are to be replied.

    1. Why?  Compliance statements clarify communication between contractor and designer.  The designer can verify that the contractor reviewed the specification and the contractor can explain why their product or drawing deviates from spec.

  5. If sub-subcontractors or sub-vendors are utilized, it should be the responsibility of the prime subcontractor to directly issue and manage all relevant submittals.

    1. Why?  Each document hand-off step is an opportunity for delay, increasing the probability of a longer cycle or lead time.

  6. Change workflow such that any obvious consultant items are sent direct, bypassing the architect “review” step.

    1. Why?  Oftentimes submittals for engineer review get hung-up with the architect for no reason other than they are busy.  Eliminating this step can decrease cycle and lead time.

  7. Change the workflow such that submittal reviews are two-step.  Step one is a cursory review for proper formatting (stamps, equipment labeling, compliance statements) and should have a 2-4 day lead time.  Step two would consist of the full review which would carry that same lead time.

    1. Why?  Where is the value in waiting 8 days for a submittal response that will ultimately get rejected on a technicality after a 15 minute review?

  8. Designers to provide clear, listed responses that can be tracked over each issuance.

    1. Why?  The submittal comment format is not standardized and oftentimes comments are buried in the documentation.  Cleanly formatted lists ensure all comments will be visible to the receiver.

  9. Set a goal for no more than two re-submittals.  The third should be for record only.

    1. Why?  Goals help “set the tone” or set expectations for all project parties.

  10. Triage submittals by categories “Ordinary”, “Semi-Custom”, “Specialized” to indicate product lead times.

    1. Why?  Categories can signal to the submittal reviewer approximate time to review or criticality of review.  For example, valves labeled “Ordinary” would signal a short review, whereas a pump labeled “Specialized” would signal long delivery lead time and expedited review.

  11. GC to expedite the first submittals for larger equipment that are anticipated to undergo multiple reviews.

    1. Why?  Initial submittal steps after the log is generated should be to prioritize submittals for larger/more complex equipment with long lead times.

  12. GC to reduce expected review times on R&R resubmittals.

    1. Why?  The first submittal review on average should take longer than second or third reviews. The second or third review should be intended to verify earlier comments are addressed.

Covid Impacts on PJM Demand

Like everyone else, PJM has had to react to the impacts of Covid-19 on their operations. Their Systems Operations Subcommittee has created an Operations Pandemic Coordination Team to discuss pandemic coordination operations. In addition, weekly on Fridays, PJM is providing status updates for each state and other members/stakeholders.

Estimated Impact Daily Peak and Energy.jpg

PJM Planning Committee has also been generating weekly updates on Covid-19 impacts to load. The graph above was taken from the most recent (April 14, 2020) presentation. Here are the findings:

  • On weekdays last week (week of 4/6), peak came in on average 8-9% lower (~7500 MW) than anticipated.

  • Largest impacts so far were around 10-11% (~9500 MW) on 3/26.

  • Energy has been less affected, with average weekday reduction since mid-March being 7%.

  • Weekends have been impacted less (~2-4%)

Take-aways: Obviously the change in work patterns via stay-at-home/shelter-in-place orders have impacted demand, but how so? What about the huge increase in unemployment? If the 8% reduction in peak is coincidental load, does that mean the energy footprint of our office employees while at work is higher than when working from home? What about the weekend load, is that all retail closures? Difficult to say at this point what the root cause is with so many variables.

Thoughts on Oil

I recently reread the book “Oil on the Brain: Petroleum’s Long, Strange Trip to Your Tank” by Lisa Margonelli.  Published in 2008, the reader is taken up the American gasoline supply chain - gas station, fuel haulers/wholesalers, refinery, drilling rig, Strategic Petroleum Reserve, NYMEX, Venezuela, Chad, Iran, Nigeria, and China - digging into all the details you may have questioned but never bothered to investigate.  It’s a good read and worth the time if you have it.  Recent comments by President Trump about “keeping” Middle East oil (here, here, and here) piqued my interest and is what motivated me to pick up Lisa’s book again. It got me wondering, whatever happened to oil?

If you recall, in the early 2000s there seemed to be an obsession about peak oil and its subsequent geo-political ramifications (of the 10 documentary films referenced on the ‘Peak Oil’ Wiki page, all were released between 2004 and 2008).  But over the past ten years the oil conversation has vanished from the national conversation (at least in the media).  I did some quick research on the EIA’s site and pulled the following two graphs.

Graph courtesy of the EIA.

Graph courtesy of the EIA.

Without getting into all the science behind petroleum, we can clearly see between the two graphs that American domestic production has increased (1,829,000 barrels in 2008 and 4,011,000 in 2018) and crude imports have decreased (4,727,000 barrels in 2008 and 3,629,000 barrels in 2018).  The idea of becoming more reliant on foreign oil has at least, for now, been deferred due to expansions in unconventional domestic oil production. With that deferment comes the alleviation of fears and as such, we’ve stopped talking about it.  As a finite natural resource however, we will no doubt pick this conversation up again in the next 10, 20, 30 years or so.

Graph courtesy of the EIA

Graph courtesy of the EIA

Back to the book…

In the Iran chapter, the author interviews an unnamed individual who is “on the outs with the regime.”  Through their comments we can infer the individual is informed and had high(er) level access within the government.  She states:

My host worried that as oil fields around the world are depleted, leaving the bulk of supplies in the Middle East, the world’s wrath will turn here.  “Things will start to get crunchy,” he says with a grin.  “If I’m right, finding oil will be an enormous problem for the U.S. suburbia,” he says.  “They are the most important socioeconomic community on this planet, and they are not going to take the destruction of their way of life lying down.  They have an enormous power to change American politics – everything is possible.  Maybe even an end to democracy.  Forget about nuclear weapons and terrorism.  I am very worried about the explosive power of panicked suburbia.”

This statement has stuck with me and was the impetus for writing this post.  Is it not true?  Are American suburbanites the least politically motivated yet most powerful constituency in modern society?  What happens when the level of comfort in suburbia falls?  How does this idea reflect on our policies and governance?

Interesting Things out of Texas

Image courtesy of ERCOT

Image courtesy of ERCOT

Yesterday, Bloomberg had posted a brief article on wholesale electricity prices in ERCOT, noting near record high prices on Monday as a function of extreme heat, lighter wind speeds, and coal plant decommissioning. Yesterday morning around 8AM, ERCOT was projecting higher demand than available capacity, predicting another round of record prices and potential brown-outs. This morning, Bloomberg's follow-up piece noted that yesterday wholesale prices reached the $9000/MWh cap (employed by ERCOT to limit runaway pricing) for about five hours. According to ERCOT, they came within ~2100MW of their actual capacity. The last unit to come online was a retired coal plant that was brought back online in anticipation of this event. It may come as a surprise to many of us that wind makes up anywhere between 15-27% of ERCOT's electricity mix, a significant contribution from a renewable asset. The percentage contribution doesn't correlate with actual generation and depends on other factors. For example, in March, when wind contributed 22% of electricity mix, it generated 6045 GWhs, but in July, it generated 6146 GWhs which constituted only 15%.

Image courtesy of ERCOT

Image courtesy of ERCOT

Overall, wind has been a been a viable renewable asset for Texas/nationwide but has also contributed to some inefficiencies in the market. It'll be interesting to see how ERCOT manages this moving forward; where investment dollars go regarding technology type.

Construction is a Manufacturing Process - Part 2

Most of us (reading this post) work in the construction industry, or the AEC (Architecture, Engineering, and Construction) to put it more broadly.  Whether you are a designer or builder, the goal is generally always to construct (let’s ignore academic architects for the time being).  And in construction, the ideal process includes the procurement, delivery, and installation of materials in a non-disruptive sequential order, per the design specifications, that together create a functional system satisfying the design intent (that’s a mouthful).  In short, we want to get the right material on-site at the right time so that it can be installed by the contractor without screwing up work performed simultaneously by other contractors – get in and out as quickly as possible.  “Getting in” is easy, it’s the “getting out” part that is a challenge.  “Getting out” isn’t just turning on power and walking away, it’s the successful integration of all components whether its envelope layering or boiler feedwater controls.  It is this 10% of a contract requirement that can be the most stubborn and costly for owners and contractors.  Does the end product meet or exceed the design intent?  Is the owner satisfied?  Here’s how thinking like a manufacturer can help.

how are they similar.jpg

As mentioned in the prior post, construction is a project type manufacturing process with the end product a building, facility, or structure. Traditional manufacturing, out of necessity, has become more and more efficient at delivering the same product at a higher quality for less. They have taken the deep dive down the lean rabbit hole and are not looking back…

how is manu more efficient.jpg

Here are a few ways we can continue to align construction with traditional manufacturing and shatter efficiency targets:

  1. Expand the use of 3D CAD.

    1. Collaborative designing and BIM accelerate the design process, expediting iterations and avoiding major material conflicts.

  2. Incorporate testing requirement expectations.

    1. Commissioning has become more common, but still not every contractor expects it. Embed it in the contract and specifications before issuing to bid.

  3. Make clear ALL expectations.

    1. Relieve some of the contractor errors or coordination complications by clearly communicating every expectation and watch costs come down. If everyone is making money, the market will weed out the greedy.

  4. Start tracking costs better.

    1. Knowing at a granular level that the chiller cost on job Y was 2x the cost on job X, or the labor to drywall 1000 SF was 1/3 the cost on job W is very powerful. Eliminate the mystery behind estimating to achieve optimal value.

  5. Prefab more components.

    1. With BIM, many field fabricated components can be shifted to a shop environment where quality control is heightened.

  6. Build modular blocks in controlled environments.

    1. Take prefab one step further by building self-supported rooms or spaces offsite, rigging into place at site, constructing the superstructure and finishes simultaneously.

  7. Introduce more industry standardization.

    1. Both on the material side and the technology side (how many different construction management softwares do we need to learn?)

  8. Utilize Integrated Project Delivery (IPD) or other multi-party contracts.

    1. These are the best mechanisms for changing how things get built.

  9. Accept the truth behind all meetings and re-evaluate.

    1. When you realize most meetings are held to inform 1-2 people, you realize there is a better way to approach the problem of communication.

  10. Lastly, teach architects that it’s OK not to be different all the time!

    1. Seriously, not in all cases, but if architects had a better understanding of the implications of their decisions, I bet our built environment would look very different.

Construction is a Manufacturing Process - Part 1

Image courtesy of Guerdon Modular Buildings

Image courtesy of Guerdon Modular Buildings

In the manufacturing sector, “process selection” per Jacobs and Chase, authors of Operations and Supply Chain Management, refers to the “strategic decision of selecting which kind of production processes to use to produce a product or provide a service.”  The process is generally selected based on production volume which is a function of customization.  If you produce high margin, low volume product, manual assembly may be a good fit.  If you produce low margin, high volume product, a continuous assembly line is probably best.

Manufacturing process can be placed on a spectrum in order of production volume and customization:

  1. Continuous Process.  Highest yield, typically a commodity.

    1. Ex. Petroleum refinery, chemical processing, etc.

  2. Assembly line.  Work processes are arranged according to the progressive steps which the product is made.

    1. Ex.  High volume items where specialized process cannot be justified.

  3. Manufacturing cell.  Dedicated area where products that are similar in processing requirements are produced.

    1. Ex.  Metal fabrication, computer chip manufacturing, small assembly work.

  4. Workcenter/Job Shop.  Similar equipment and functions are grouped together.

    1. Ex. Small part quantity toy where stamping, sewing, and painting are performed separate from assembly.

  5. Project.  Lowest yield, mostly all custom product.   Manufacturing equipment is moved to the product rather than vice versa.

    1. Ex. Home, plant, building, bridge construction; movie shooting lots

When was the last time you thought of a construction project as a manufacturing process?  Probably never.  Why do we think that is the case?  And is it not right to think that way (why does it matter)?

Courtesy of GettyImages

Courtesy of GettyImages

I’ve been thinking a lot about these questions over the past year as I’ve floated in and out of multiple construction projects.  As a consulting engineer I perform project work.  We are hired for a defined task or tasks, we execute on that task, and we then move on.  And when I’m a team member of these projects, I’m party to the confusion, headaches, and wastefulness that so often accompanies construction.  So as a value-oriented individual, I can’t help but notice as a manufacturing process, we’re so far removed from typical manufacturing culture including all of the efficiencies they offer.

Think about what a “project” manufacturing process might qualify as – a standalone, custom/unique assembly of high quantities of components in a complex sequence – which is basically a building or facility.  If our “product” is a house or lab or office, the process to “assemble” (build) is no different than the process to “assemble” (produce) an automobile or can of soup or a gallon of gasoline.

I believe it, and so do some forward-thinking individuals at the Lean Construction Institute, but construction has been dogged by hardened behaviors resistant to change.  Anyone from the lowest level laborer to the project executive can point to areas of gross wastefulness in construction.  When we think about construction like Ford thinks about SUVs, Pepsi about soda, or Johnson & Johnson thinks about shampoo, you start to realize why WE SHOULD think this way (and why it matters)! Per LCI, “Construction labor efficiency and productivity has decreased, while all other non-farming labor efficiency has doubled or more since the 1960s. Currently, 70% of projects are over budget and delivered late. The industry still sees about 800 deaths and thousands of injuries per year. The industry is broken.”

What the PJM Generation Retirement Queue Currently Looks Like

Courtesy of PJM

Courtesy of PJM

Two weeks ago I was asked to assist with the startup of one of four converted coal-to-natural gas boilers in Virginia. At the plant, a 150 MWe, eight boiler coal fired cogen plant, half of the boiler burners were being converted to natural gas. What I was hearing for the reasoning behind the investment mirrored what you have read in the news - it was just too expensive to operate while burning coal.

So, like any engineer, it got me thinking about how ubiquitous these conversions or closings actually are. Fortunately, PJM maintains an awesome website with tons of downloadable data. Under the Planning section of their site you can find a list of power plants who have applied for deactivation. I was able to download this data and run some quick analysis. Note that these are planned deactivations and the applications can be withdrawn in the future (so no guarantee of retirement).

In PJM’s retirement queue, as of March 27, 2019, there are 62 plants representing about 12,722 MWs of capacity. Coal fueled plants represent about 40% of the number of plant retirements, and about 55% of the capacity. Note that while only 5 nuclear fueled plants are retiring, they represent another 37% of capacity (92% of capacity retirement is from coal and nuclear)!

Data courtesy of PJM

Data courtesy of PJM

Data courtesy of pjm

Data courtesy of pjm

And my next question was, “in what states are the coal and nuclear retirements from?”

Data courtesy of PJM

Data courtesy of PJM

Data courtesy of pjm

Data courtesy of pjm

As you can see, plant retirements in Ohio dominate all others. Total plant retirement capacity in Ohio is 5934 MW, or about 46% of all PJM retirements.

Fortunately for us, the Ohio Public Utilities Commission (PUCO) publishes a long-term energy forecast that details current and forecasted energy generation, consumption, and other great info. Turns out that as of December 2018, Ohio gets 45% of it’s electricity generation from coal fired sources, 38% from natural gas, and 15% from nuclear. And in 2016, the non-coincident summer peak load was 31,469 MW. Now, if we figure the PJM plant projected retirement date goes out to 2020/22, that means Ohio could lose 20% of it’s capacity in the next three years!

Graph courtesy of Ohio Public Utilities Commission

Graph courtesy of Ohio Public Utilities Commission

And so what is our take-away from this shallow dive? There is an obvious disproportionate amount of coal-fired assets that are currently planned to retire, but there is also a surprisingly large capacity of nuclear planned as well. Those who advocate coal plant retirement as an environmental goal will be pleased, but keep in mind how much emission free nuclear energy is going with it. Also keep in mind that along with these fuel types goes a stable base-load asset with fuel that is cheaply stored on-site.

Another interesting finding was PJM’s Learning Center that discusses (in plain English) what steps are taken when a generating plant retires. See the image/diagram below (from PJM). In short, generator retirements and any required system upgrades to keep the grid running smoothly are included in the PJM Regional Transmission Expansion Planning process.

pjm plant retirement.jpg

Explaining Power Plant Retirements in PJM

Per PJM:

PJM Ensures that replacement generation is available to cover lost MWs from the retired plant - this replacement could come from newly built power plants, upgrades to existing plants, or from sources external to PJM. PJM’s capacity market helps secure power supply resources to meet future demand on the grid.

Since transmission lines and distribution lines are all interconnected, upgrades to the system allow electricity to flow on multiple paths and in turn increase the overall flow of electricity.

This means that these kinds of upgrades typically end up bringing more MW (in this example, 1000 MW) onto the system as a whole than the amount of MW lost (800 MW) at a single point, from the retired plant.

The (Other) Value of the DOE

If you haven’t read any Michael Lewis books and have an interest in government, I highly recommend his latest titled “The Fifth Risk”. In the book Lewis uses seemingly mundane cabinet level federal departments to highlight the risks those same departments mitigate each day.

Image courtesy of Greentech Media.

Image courtesy of Greentech Media.

In one chapter, Lewis interviews John MacWilliams who became the first DOE Chief Risk Officer from 2013 to 2017. Besides discussions on the risks posed by nuclear weapons (over half the DOE budget is allocated to nuclear energy management, one of it’s core values to the American public), MacWilliams describes his investigation into the department’s $70 billion loan program. Yes, this is the same loan program that provided a load to Solyndra who later filed for bankruptcy. Lewis states:

“Politically, the loan program had been nothing but downside. No one had paid any attention to its successes, and its one failure - Solyndra - had allowed the right-wing friends of Big Oil to bang on relentlessly about government waste and fraud and stupidity. A single bad loan had turned a valuable program into a political liability. As he dug into the portfolio, MacWilliams feared it might contain other Solyndras. It didn’t, but what he did find still disturbed him. The DOE had built a loan portfolio that, as MacWilliams put it, ‘JPMorgan would have been happy to own.’ The whole point was to take big risks the market would not take, and they were making money! ‘We weren’t taking nearly enough risk,’ said MacWilliams.”

  1. The DOE loan program was intended to invest in new commercially ready technology that could change the energy landscape. Energy is a commodity business with low margins, something that inhibits investment into new and different things. There are few financially stable businesses that can sustained multi-year (or multi-decade) research programs for the next new energy technology AND recoup their investment in the market. What MacWilliams was saying is that the program worked and worked well. Not only was the DOE making their money back but they were changing how our society approached energy generation and delivery.

  2. Since the late 2000s, renewable energy technology has penetrated almost all market sectors with success. A new study published by Lazard clearly shows that utility scale PV levelized cost of energy/electricity (LCOE) ($36-46/MWh) meets or exceeds the LCOE lower bound for gas combined cycle plants ($41-74/MWh), one of the cheapest fossil-fuel generation options, a clear success for the DOE.

  3. I designed and installed a commercial rooftop Solyndra system in the Philadelphia region around 2010. Yes, it “works”. Yes, it was different than a flat panel install, but it still “worked”.

Is Weather Becoming More Extreme? Let's look at the data...

There’s been a lot of talk on various media outlets about “extreme” weather events, their ferocity and frequency, and how this is the “new normal”. And of course these days you can’t talk about weather without also talking about climate change. Regardless of whether you’re a believer or skeptic, I wanted to see what the data has to say regarding extreme weather: on average, is our (national) weather becoming more extreme, less, or about the same as it was?

Fortunately, our government has a comprehensive website detailing extreme weather events dating back to 1910. The National Oceanic and Atmospheric Administration (NOAA) publishes all sorts of great data on weather events via the National Center for Environmental Information (formerly the National Climatic Data Center).

Courtesy of the NOAA

Courtesy of the NOAA

In the graph above, the data compiled for each year (red columns) is “based on an aggregate set of conventional climate extreme indicators which include monthly maximum and minimum temperature, daily precipitation, monthly Palmer Drought Severity Index (PDSI), and landfalling tropical storm and hurricane wind velocity.” Additional background information on their methodology and data can be found here.

If we follow the 9-pt binomial filter (a recognized statistical smoothing technique), it’s apparent that extreme weather events have increased steadily since 1970 and have peaked in the last 10 years. We also notice that extreme weather events between 1910 and 1970 gradually decreased 5-8% points. For this post we’re not examining the root cause, only resultant data, so how or why the events trend downward then shoot up is for another time. In any case, there is a clear spike in events starting in the mid-1990s.

So why does this matter? Increasing extreme weather events matter for various reasons, the most obvious of which is the cost to rebuild/reconstruct, a majority of which is paid by taxpayers and via insurance premiums (the greater the risk, the more we all pay). Other consequences are the loss of economic activity when priorities are shifted to reconstruction, the costs to reinforce existing infrastructure in preparation for future events, and an increase in uncertainty for strategic planners who rely on steady data to manage risk.

Oh, and if you were curious how much these extreme events were costing us, the NOAA was kind enough to graph that as well. 2011, 2017, and 2016 were the most expensive years ever recorded, with 2018 already exceeding the fourth largest with three months left to go…

Courtesy of NOAA

Courtesy of NOAA

Five Whys When Troubleshooting

Photo courtesy of toyota

As a commissioning engineer I frequently find myself interacting with equipment or systems that don't want to function.  A motor that won't start, a breaker that trips, or a chiller that faults, each situation requires a fundamental understanding of all externalities and internal mechanics.  Often under the gun (will touch on optimistic scheduling at a later date), any tech/engineer is forced to assess the issue as quickly as possible.

Photo courtesy of toyota

A great tool for this application is "Five Whys".  The provenance of the Five Whys is traced to Taiichi Ohno, pioneer of the Toyota Production System in the 1950s.  Developed as a high level root cause analysis, Ohno encouraged his staff to address problems first-hand until the issue was found.  "The root cause of any problem is the key to a lasting solution," Ohno used to say.

Let's work through an example:

1. Why did the chiller trip offline?  Ans: It was determined that the chiller shutdown on low flow.

2. Why was there a low flow condition at the chiller?  Ans: The low flow condition occurred when pump 2 was rotated onto pump 3.

3. Why was there a low flow condition during the rotation?  Ans: The operator did not ramp pump 3 fully before shutting down pump 2.  Pump 2's deceleration time was set to 2 seconds.

4. Why was the pump deceleration time set to 2 seconds?  Ans: Pump deceleration time standard is 30 seconds.  The 2 second timer was accidentally inputted by the startup technician and overlooked by the operator.

5. Why was the 2 second timer overlooked by the operator?  Ans: Operators are handed equipment that are supposed to be fully vetted by contractors, vendors, and engineers.  Operators are not trained or required to verify pump drive settings after a project is turned-over.

The end result of this exercise leaves us with likely root causes. Was there an uncomprehensive startup and testing process during construction? Or is their a gap in operator training and associated SOPs (if they are rotating pumps weekly, shouldn’t this flaw have been identified earlier)?

Intuitively, the Five Whys is qualitative and therefore imprecise. Like a decision tree, there are many iterations of possible root causes. However, this does help organize thoughts and provide insight as to what direction the forensic study needs to follow.


Distributed Energy Resource (DER) Siting

Interesting article in the new SolarPro about how states (California) are pushing utilities to use their capacity and capital planning information to optimize the siting of PV and storage projects.  As many of us know, the interconnection process for large commercial and utility projects can be a game of chance.  What the line capacity is (and therefore how big the system can be) and whether there are required upgrades is determined after a lengthy review.  The initial responses generally include hefty cost estimates to proceed with what amounts to a nameplate size significantly less than what was proposed.

LNBA Demo B.jpg

The CPUC (California Public Utility Commission) created two working groups to address the issue: the Integration Capacity Analysis (ICA) and the Locational Net Benefits Analysis (LNBA).  Above is the heat map for the LNBA demo.  Per CPUC, "the goal is to ensure DERs are deployed at optimal locations, times, and quantities so that their benefits to the grid are maximized and utility customer costs are reduced."

Why is this important?  Consider the $2.6 billion planned transmission project upgrades in California that were recently revised down, accounting for higher forecasts of PV and energy efficiency projects.  And besides the avoided costs, don't forget all the grid upgrades DER developers are paying for that benefit all consumers.  This is a key factor in the debate over whether PV owners pay their fair share, or rather whether non-DER owners are subsidizing DER projects.  With the federal investment tax credit decreasing to 26% in 2020, 21% in 2021, and 10% in 2022, the models generated in the CPUC exercise can be used to reduce development costs, defer distribution and transmission capital improvements, and lay the groundwork for incentivizing grid-beneficial siting.

Enron and PV Module Warranties

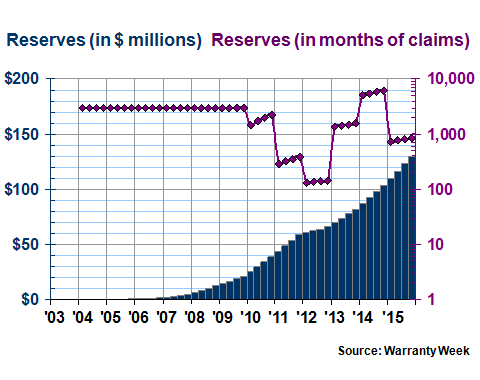
While reading an article in Wired about equipment failures, I came across an interesting website called Warranty Week, an amalgam of equipment warranty research and insight.  Written/hosted by Mr. Eric Arnum out of his home office in Forest Hills, NY, he does deep dives into everything from extended warranty revenues, product claims, recalls, federal and state regulation, and warranty reserves (most important)!  Also, who knew an Extended Warranty and Service Contract Innovation Forum existed?  Browse his headlines for current events or head straight to the solar equipment warranty page for the good stuff.  In a July 28, 2016 post on solar equipment warranties, Mr. Arnum writes that, "In general, what we're finding is that most of the manufacturers are financing their very long warranties properly, while most of the installers are playing for the short term, hoping that the manufacturers will be there to pay at least the cost of replacement parts."  So the good news is, for owners large and small of PV systems, both workmanship and production warranty claims should be upheld.  Mr. Arnum can better explain the bad news: "But here's the central problem: none of the nine companies we're following have been financing warranty expenses since 2003. Four started in 2004, and one started in 2005. The rest have even less experience than that. And they really don't know what failure rates will look like in decades to come, nor do they have a good grip on repair or replacement costs in the year 2025 or beyond. So even the ones that are good at it are guessing."  From a failure rate perspective, at least as of 2016, nobody knows for sure just how long modules will last!

Checkout the Wired article for more insight into how major manufacturers design and test components, and for more background on Mr. Arnum's research.  I'll be posting separately about this issue at a later time.

Also, why did I title this post Enron and PV?  Because the collapse of Enron led to changes to the Generally Accepted Accounting Principals (rules that govern how companies write financial statements) which as of November 2002, required companies to provide detailed information on their guarantees, warranty reserves, and warranty payments in quarterly and yearly filings.  It is these filings that are the foundation to Mr. Arnum's research.

The Software Apocalypse

There was a great article published in The Atlantic late last year, The Coming Software Apocalypse, that took a hard look at the crossroads of software ubiquity, safety, and subject expertise (does anyone actually really understand how anything works anymore).  The evolution of technology has been so exhaustingly expeditious that for the average American it can be easy to forget both how amazingly complex software is but also that technology once existed without it altogether.  In 2014, the entire State of Washington experienced a six hour blackout of its 911 system.  During this time, if you were to dial 911 you would have heard a busy signal, a frightening sound if say you were alone in your house subject to an (alleged) breaking and entering.  Which in fact the story cites as at least one example of why the 911 system going down is a bad thing (the homeowner actually called at least 37 times).  It was later discovered that the outage was caused by a glitch in the software code designed to keep a running count of incoming calls for recordkeeping.  Turns out, the developers set the counter upper limit to a random number in the millions which just so happen to occur.  With each new call, a unique number was assigned.  On the day the upper limit was reached, calls were rejected because they were not assigned a unique number.  Insert chaos.

photo courtesy of paramount pictures

The programmers of the software did not immediately understand the problem in part because it was never deemed critical.  And because it was not critical it was never assigned an alarm.  There was a time when emergency calls were handled locally, by people.  The promise of innovation led the system to shift away from mechanical or human operation and rely more and more on code.

“When we had electromechanical systems, we used to be able to test them exhaustively.  We used to be able to think through all the things it could do, all the states it could get into,” states Nancy Leveson, a professor of aeronautics and astronautics at MIT.  Thinking about a small system (a gravity fed sewer wet-well, an elevator, a railroad crossing) and all of its modes of operation, both likely and unlikely, you can jot down on a single sheet of paper.  And each one of those items you can visually inspect, observe, and verify appropriate (and inappropriate) responses to operating scenarios and externalities.

Software is different.  By editing the text in a file somewhere (it does not have to be local to the hardware), that same processor or controller can become an intelligent speaker or a self-driving car or logistics control system.  As the article states, “the flexibility is software’s miracle and its curse.  Because it can be changed cheaply, software is constantly changed; and because it is unmoored from anything physical-a program that is a thousand times more complex than another takes up the same actual space-it tends to grow without bound.”  “The problem is that we are building systems that are beyond our ability to intellectually manage,” says Leveson.

Because software is different, it is hard to say that it “broke”, like say an armature or a fitting break.  The idea of “failure” takes on a different meaning when applying it to software.  Did the 911 system software fail or did it do exactly what the code told it to do?  The reason it failed was because it was told to do the wrong thing.  Just like a bolt can be fastened wrong or a support arm is designed wrong, wrong software will lead to a “failure”.

As software-based technology continues to advance, as engineers we need to keep all of this in the back of our minds.  It is challenging to just be a single discipline engineer these days.  To really excel in your (our) field, you must be able to think beyond your specialty to fully grasp the true nature of your design decisions.